Shifted calendars
In s2s weather forecasting modelling we often use a calendar type that ‘rolls’ forward over time.
For example, we wish to forecast temperature for every week of June and July with a two week leadtime, keeping that leadtime constant.
This imitates an Numerical Weather Prediction (NWP) model that is initiated every week.
Another example could be that we wish to investigate the influence of intraseasonal variability of one of our precursors over time.
With lilio.calendar_shifter, the user can easily create calendars that suit these needs. This notebook shows how to: * Shift a calendar n number of times and return a list of those calendars * Resample a dataset to those calendars resulting in an xarray.Dataset where the data is concatenated along a new dimension with default name ‘step’
Note that the anchor year for every target period is kept the same relative to the first calendar. Even if a target period is shifted to the next year, the anchor year of the target period stays the same.
[1]:
import lilio
import matplotlib.pyplot as plt
import numpy as np
import xarray as xr
import pandas as pd
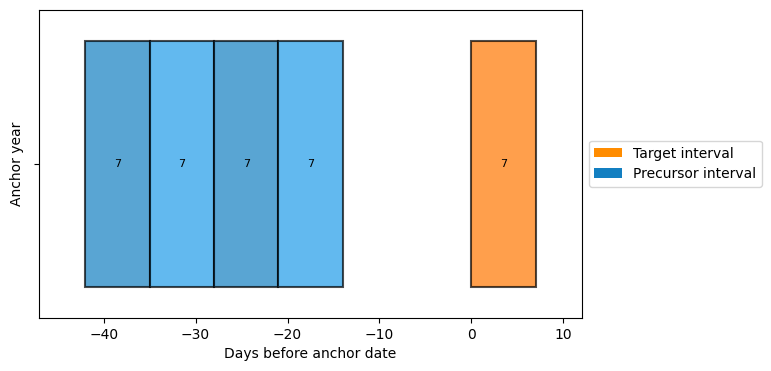
Let’s initiate a calendar with the following characteristics: * starting on July 1st * 1 target interval with 7 days length * 4 precursor intervals of 7 days length * 14 days leadtime between the target interval and first precusor interval
[2]:
cal = lilio.Calendar(anchor='07-01')
cal.add_intervals("target", "7d")
cal.add_intervals("precursor", "7d", gap="14d")
cal.add_intervals("precursor", "7d", n=3)
cal.visualize(show_length=True)
Setting relative_dates=True. To see absolute dates, first call calendar.map_years or calendar.map_data
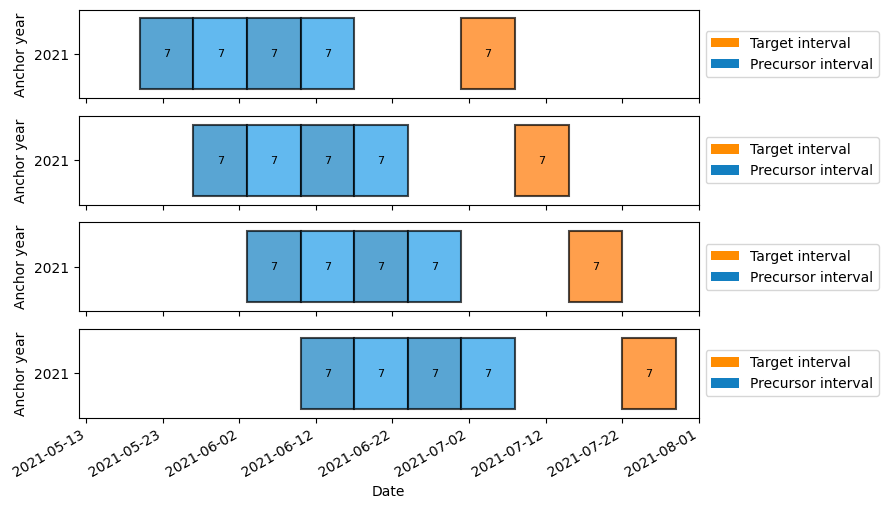
Then we build up a list of calendars. We shift (using lilio.calendar_shifter.staggered_calendar) the initial calendar by 7 days three times such that we get four calendars:
(note that the anchor date does not change, only the gaps relative to the anchor date change)
[3]:
cal_list = lilio.calendar_shifter.staggered_calendar(cal, shift='7d', n_shifts=3)
We map all the calendars to some year (2021) before visualizing:
[4]:
for cal in cal_list:
    cal.map_years(2021,2021)

fig, axes = plt.subplots(nrows=len(cal_list), sharex=True, figsize=(8,6))
for i, cal in enumerate(cal_list):
    cal.visualize(n_years=1, relative_dates=False, show_length=True, ax=axes[i])
axes[-1].set_xlim([np.datetime64("2021-05-12"), np.datetime64("2021-08-01")])
fig.autofmt_xdate()
Before resampling, we make a dummy dataset:
[5]:
time_index = pd.date_range('20160101', '20211231', freq='1d')
ds = xr.Dataset(
    data_vars=dict(data=('time', np.random.random(len(time_index)))),
    coords=dict(time=time_index)
)
ds
[5]:
<xarray.Dataset> Size: 35kB
Dimensions:  (time: 2192)
Coordinates:
  * time     (time) datetime64[ns] 18kB 2016-01-01 2016-01-02 ... 2021-12-31
Data variables:
data (time) float64 18kB 0.6525 0.3915 0.2633 ... 0.04839 0.2075 0.138Resample by using the lilio.calendar_shifter.calendar_list_resampler function.
Before we resample, it is important to map our calendar to the desired years. Before, we mapped it to the year it to 2021. Now, we can set it to other years using:
for cal in cal_list:
    cal.map_years(2018,2021)
or we use the cal.map_to_data function to map our calendar to the dummy dataset:
for cal in cal_list:
    cal.map_to_data(ds)
Map to data:
[6]:
for cal in cal_list:
    cal.map_to_data(ds)
Now we we have to resample ds to all the calendars in cal_list using lilio.resample.
We can do that with a simple list comprehension:
[7]:
ds_r_list = [lilio.resample(cal, ds) for cal in cal_list]
If you wish to also concatenate all resampled data to one xr.Dataset, we can use the built-in lilio.calendar_shifter.calendar_list_resampler function which resamples the data to all the calendars in cal_list and concatenates these datasets along a new dimension (default name is ‘step’).
[8]:
ds_r = lilio.calendar_shifter.calendar_list_resampler(cal_list, ds)
ds_r
[8]:
<xarray.Dataset> Size: 3kB
Dimensions:      (step: 4, anchor_year: 6, i_interval: 5)
Coordinates:
  * anchor_year  (anchor_year) int64 48B 2016 2017 2018 2019 2020 2021
  * i_interval   (i_interval) int64 40B -4 -3 -2 -1 1
    left_bound   (step, anchor_year, i_interval) datetime64[ns] 960B 2016-05-...
    right_bound  (step, anchor_year, i_interval) datetime64[ns] 960B 2016-05-...
    is_target    (i_interval) bool 5B False False False False True
  * step         (step) int64 32B 0 1 2 3
Data variables:
    data         (step, anchor_year, i_interval) float64 960B 0.7552 ... 0.482
Attributes:
    lilio_version:               0.5.0
    lilio_calendar_anchor_date:  07-01
    lilio_calendar_code:         Calendar(\n    anchor='07-01',\n    allow_ov...
    history:                     2024-06-13 11:57:33 UTC - Resampled with a L...