Resampling data
This notebook will demonstrate how to resample data with Lilio. Lilio is able to resample Pandas’ DataFrame and Series, as well as xarray’s DataArray and Dataset.
We start by importing the required libraries and generating an example Pandas Series and a DataFrame
[1]:
import numpy as np
import xarray as xr
import pandas as pd
import lilio

time_index = pd.date_range('20171020', '20211001', freq='15d')
random_data = np.random.random(len(time_index))
example_series = pd.Series(random_data, index=time_index)
example_dataframe = pd.DataFrame(example_series.rename('data1'))
example_dataframe['data2'] = example_dataframe['data1']

example_series.head(3)
[1]:
2017-10-20    0.499075
2017-11-04    0.825930
2017-11-19    0.382003
Freq: 15D, dtype: float64
The DataFrame looks similar but has two named columns:
[2]:
example_dataframe.head(3)
[2]:
| data1 | data2 | |
|---|---|---|
| 2017-10-20 | 0.499075 | 0.499075 |
| 2017-11-04 | 0.825930 | 0.825930 |
| 2017-11-19 | 0.382003 | 0.382003 |
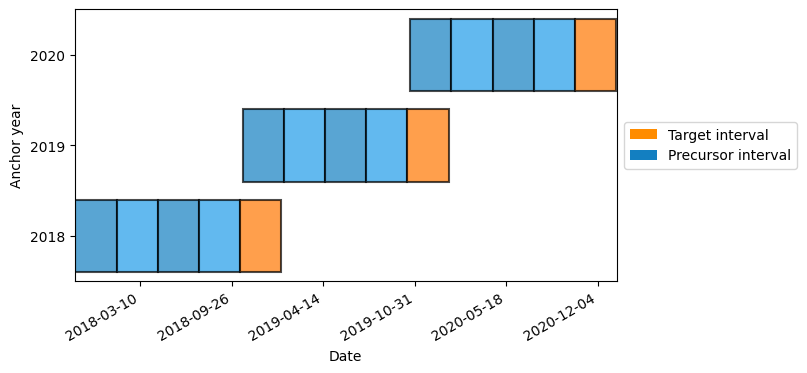
To resample we need to set up an calendar with the anchor date and frequency. In this case we choose to use the daily_calendar shorthand.
(Passing max_lag is optional, as well as allow_overlap, but this will allow us to demonstrate that resampling works even when intervals overlap)
[3]:
calendar = lilio.daily_calendar(
    anchor="10-15",
    length='90d',
    n_precursors=4,
    allow_overlap=True
)
calendar.map_years(2018, 2020)
calendar.visualize()
Next we pass the example data to the resample function. This requires a mapped calendar and the input data.
By default, resample will take the mean of all datapoints that fall within each interval. However, many other statistics are available, such as min, max, median, std, etc. For a full list see the docstring with:
help(lilio.resample)
[4]:
resampled_series = lilio.resample(calendar, example_series, how="mean")
resampled_series
[4]:
| anchor_year | i_interval | interval | data | is_target | |
|---|---|---|---|---|---|
| 0 | 2018 | -4 | [2017-10-20 00:00:00, 2018-01-18 00:00:00) | 0.699713 | False |
| 1 | 2018 | -3 | [2018-01-18 00:00:00, 2018-04-18 00:00:00) | 0.509945 | False |
| 2 | 2018 | -2 | [2018-04-18 00:00:00, 2018-07-17 00:00:00) | 0.673064 | False |
| 3 | 2018 | -1 | [2018-07-17 00:00:00, 2018-10-15 00:00:00) | 0.435493 | False |
| 4 | 2018 | 1 | [2018-10-15 00:00:00, 2019-01-13 00:00:00) | 0.479193 | True |
| 5 | 2019 | -4 | [2018-10-20 00:00:00, 2019-01-18 00:00:00) | 0.451884 | False |
| 6 | 2019 | -3 | [2019-01-18 00:00:00, 2019-04-18 00:00:00) | 0.348929 | False |
| 7 | 2019 | -2 | [2019-04-18 00:00:00, 2019-07-17 00:00:00) | 0.289580 | False |
| 8 | 2019 | -1 | [2019-07-17 00:00:00, 2019-10-15 00:00:00) | 0.646236 | False |
| 9 | 2019 | 1 | [2019-10-15 00:00:00, 2020-01-13 00:00:00) | 0.534190 | True |
| 10 | 2020 | -4 | [2019-10-21 00:00:00, 2020-01-19 00:00:00) | 0.534190 | False |
| 11 | 2020 | -3 | [2020-01-19 00:00:00, 2020-04-18 00:00:00) | 0.249639 | False |
| 12 | 2020 | -2 | [2020-04-18 00:00:00, 2020-07-17 00:00:00) | 0.394203 | False |
| 13 | 2020 | -1 | [2020-07-17 00:00:00, 2020-10-15 00:00:00) | 0.570088 | False |
| 14 | 2020 | 1 | [2020-10-15 00:00:00, 2021-01-13 00:00:00) | 0.484751 | True |
As you see above, this generates a new DataFrame containing the data resampled for each interval, along with the corresponding interval index, and the anchor year that the interval belongs to.
This works the same if you input a pandas DataFrame:
[5]:
resampled_dataframe = lilio.resample(calendar, example_dataframe)
resampled_dataframe
[5]:
| anchor_year | i_interval | interval | data1 | data2 | is_target | |
|---|---|---|---|---|---|---|
| 0 | 2018 | -4 | [2017-10-20 00:00:00, 2018-01-18 00:00:00) | 0.699713 | 0.699713 | False |
| 1 | 2018 | -3 | [2018-01-18 00:00:00, 2018-04-18 00:00:00) | 0.509945 | 0.509945 | False |
| 2 | 2018 | -2 | [2018-04-18 00:00:00, 2018-07-17 00:00:00) | 0.673064 | 0.673064 | False |
| 3 | 2018 | -1 | [2018-07-17 00:00:00, 2018-10-15 00:00:00) | 0.435493 | 0.435493 | False |
| 4 | 2018 | 1 | [2018-10-15 00:00:00, 2019-01-13 00:00:00) | 0.479193 | 0.479193 | True |
| 5 | 2019 | -4 | [2018-10-20 00:00:00, 2019-01-18 00:00:00) | 0.451884 | 0.451884 | False |
| 6 | 2019 | -3 | [2019-01-18 00:00:00, 2019-04-18 00:00:00) | 0.348929 | 0.348929 | False |
| 7 | 2019 | -2 | [2019-04-18 00:00:00, 2019-07-17 00:00:00) | 0.289580 | 0.289580 | False |
| 8 | 2019 | -1 | [2019-07-17 00:00:00, 2019-10-15 00:00:00) | 0.646236 | 0.646236 | False |
| 9 | 2019 | 1 | [2019-10-15 00:00:00, 2020-01-13 00:00:00) | 0.534190 | 0.534190 | True |
| 10 | 2020 | -4 | [2019-10-21 00:00:00, 2020-01-19 00:00:00) | 0.534190 | 0.534190 | False |
| 11 | 2020 | -3 | [2020-01-19 00:00:00, 2020-04-18 00:00:00) | 0.249639 | 0.249639 | False |
| 12 | 2020 | -2 | [2020-04-18 00:00:00, 2020-07-17 00:00:00) | 0.394203 | 0.394203 | False |
| 13 | 2020 | -1 | [2020-07-17 00:00:00, 2020-10-15 00:00:00) | 0.570088 | 0.570088 | False |
| 14 | 2020 | 1 | [2020-10-15 00:00:00, 2021-01-13 00:00:00) | 0.484751 | 0.484751 | True |
Resampling xarray data
Resampling works the same for an xarray Dataset. Note that you can use dask arrays as well, for lower memory use and distributed computation. For more info see the documentation.
Let’s make an example dataset with latitude and longitude coordinates:
[6]:
import xarray as xr

time_index = pd.date_range('20171020', '20211001', freq='15d')

np.random.seed(0)
temperature = 15 + 8 * np.random.randn(2, 2, len(time_index))
precipitation = 10 * np.random.rand(2, 2, len(time_index))

lon = [[-99.83, -99.32], [-99.79, -99.23]]
lat = [[42.25, 42.21], [42.63, 42.59]]


ds = xr.Dataset(
    data_vars=dict(
        temperature=(["x", "y", "time"], temperature),
        precipitation=(["x", "y", "time"], precipitation),
    ),
    coords=dict(
        lon=(["x", "y"], lon),
        lat=(["x", "y"], lat),
        time=time_index,
    ),
    attrs=dict(description="Weather related data."),
)
ds
[6]:
<xarray.Dataset> Size: 7kB
Dimensions:        (x: 2, y: 2, time: 97)
Coordinates:
    lon            (x, y) float64 32B -99.83 -99.32 -99.79 -99.23
    lat            (x, y) float64 32B 42.25 42.21 42.63 42.59
  * time           (time) datetime64[ns] 776B 2017-10-20 ... 2021-09-29
Dimensions without coordinates: x, y
Data variables:
    temperature    (x, y, time) float64 3kB 29.11 18.2 22.83 ... 7.116 3.225
    precipitation  (x, y, time) float64 3kB 5.25 7.506 3.335 ... 1.415 8.659
Attributes:
description: Weather related data.As you see below, the temperature and precipitation variables can easily be resampled to a new index using the calendar specified intervals.
This index dimension has as coordinates the anchor year and the interval count.
Note: both the temperature and precipitation variables have kept their lat and lon coordinates.
[7]:
ds_r = lilio.resample(calendar, ds)
ds_r
[7]:
<xarray.Dataset> Size: 1kB
Dimensions:        (anchor_year: 3, i_interval: 5, x: 2, y: 2)
Coordinates:
  * anchor_year    (anchor_year) int64 24B 2018 2019 2020
  * i_interval     (i_interval) int64 40B -4 -3 -2 -1 1
    lon            (x, y) float64 32B -99.83 -99.32 -99.79 -99.23
    lat            (x, y) float64 32B 42.25 42.21 42.63 42.59
    left_bound     (anchor_year, i_interval) datetime64[ns] 120B 2017-10-20 ....
    right_bound    (anchor_year, i_interval) datetime64[ns] 120B 2018-01-18 ....
    is_target      (i_interval) bool 5B False False False False True
Dimensions without coordinates: x, y
Data variables:
    temperature    (anchor_year, i_interval, x, y) float64 480B 23.37 ... 12.55
    precipitation  (anchor_year, i_interval, x, y) float64 480B 5.74 ... 4.758
Attributes:
    description:                 Weather related data.
    lilio_version:               0.5.0
    lilio_calendar_anchor_date:  10-15
    lilio_calendar_code:         Calendar(\n    anchor='10-15',\n    allow_ov...
history: 2024-06-11 09:21:13 UTC - Resampled with a L...Calculating bin counts
To check if you have sufficient data for each of the Calendar’s intervals, you can make use of resample(how="size"). This will give you the number of data points that are within each interval.
Especially when the intervals are of varying sizes, or your data is more sparse, then this can be very useful.
As an example, let’s make a calendar with varyingly sized intervals:
[8]:
calendar = lilio.Calendar(anchor="10-15")
calendar.add_intervals("target", length="5d")
calendar.add_intervals("precursor", length="1d")
calendar.add_intervals("precursor", length="3d")
calendar.add_intervals("precursor", length="10d")
calendar.map_years(2018, 2018)
calendar.visualize()
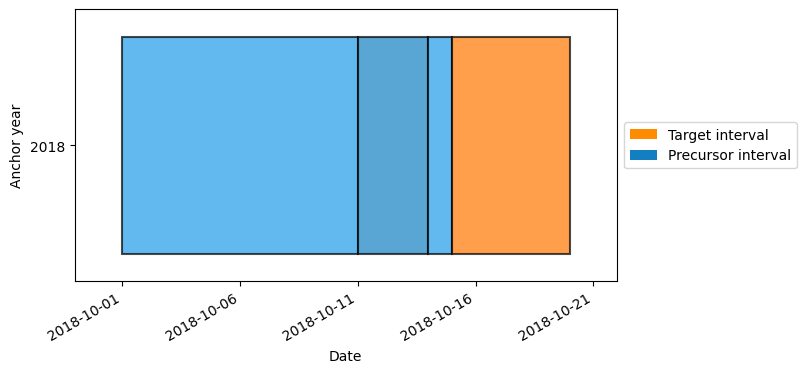
Now if we resample a dataset with a 1-day frequency, using how="size", you can see that the smallest interval contains only a single data point, while the largest interval contains ten.
Some of the resampling methods (such as “min” or “std”) of course would not make sense with such few data points per interval.
[9]:
time_index = pd.date_range('20171020', '20191001', freq='1d')
random_data = np.random.random(len(time_index))
example_series = pd.Series(random_data, index=time_index)
example_dataframe = pd.DataFrame(example_series.rename('data1'))

lilio.resample(calendar, example_dataframe, how="size")
/home/docs/checkouts/readthedocs.org/user_builds/lilio/envs/stable/lib/python3.9/site-packages/lilio/utils.py:171: UserWarning:
  The input data frequency is very close to the Calendar's frequency.
  This could lead to issues like aliasing or incorrect resampling.
  If possible: make the Calendar's intervals larger, or use data of a
  higher time resolution.
  warnings.warn(
/home/docs/checkouts/readthedocs.org/user_builds/lilio/envs/stable/lib/python3.9/site-packages/lilio/utils.py:78: UserWarning:
  Some intervals only contains a single data point.
  This could lead to issues like aliasing or incorrect resampling.
  If possible: make the Calendar's intervals larger, or use data of
  a higher time resolution.
  warnings.warn(  # type: ignore
[9]:
| anchor_year | i_interval | interval | data1 | is_target | |
|---|---|---|---|---|---|
| 0 | 2018 | -3 | [2018-10-01 00:00:00, 2018-10-11 00:00:00) | 10.0 | False |
| 1 | 2018 | -2 | [2018-10-11 00:00:00, 2018-10-14 00:00:00) | 3.0 | False |
| 2 | 2018 | -1 | [2018-10-14 00:00:00, 2018-10-15 00:00:00) | 1.0 | False |
| 3 | 2018 | 1 | [2018-10-15 00:00:00, 2018-10-20 00:00:00) | 5.0 | True |
Custom resampling methods
The how argument also accepts any function with a single input and a single output argument. This allows you to use custom defined functions to resample the data.
For example:
[10]:
def root_mean_squared(data):
    return np.mean(data ** 2) ** 0.5

lilio.resample(calendar, example_dataframe, how=root_mean_squared)
/home/docs/checkouts/readthedocs.org/user_builds/lilio/envs/stable/lib/python3.9/site-packages/lilio/utils.py:171: UserWarning:
  The input data frequency is very close to the Calendar's frequency.
  This could lead to issues like aliasing or incorrect resampling.
  If possible: make the Calendar's intervals larger, or use data of a
  higher time resolution.
  warnings.warn(
/home/docs/checkouts/readthedocs.org/user_builds/lilio/envs/stable/lib/python3.9/site-packages/lilio/utils.py:78: UserWarning:
  Some intervals only contains a single data point.
  This could lead to issues like aliasing or incorrect resampling.
  If possible: make the Calendar's intervals larger, or use data of
  a higher time resolution.
  warnings.warn(  # type: ignore
[10]:
| anchor_year | i_interval | interval | data1 | is_target | |
|---|---|---|---|---|---|
| 0 | 2018 | -3 | [2018-10-01 00:00:00, 2018-10-11 00:00:00) | 0.516371 | False |
| 1 | 2018 | -2 | [2018-10-11 00:00:00, 2018-10-14 00:00:00) | 0.714292 | False |
| 2 | 2018 | -1 | [2018-10-14 00:00:00, 2018-10-15 00:00:00) | 0.363845 | False |
| 3 | 2018 | 1 | [2018-10-15 00:00:00, 2018-10-20 00:00:00) | 0.686525 | True |
[ ]: